Economic Update – Summer 2018 Edition
Summer in the Midwest this year has come with two flavors – either scorching heat or epic downpour. There have not been many days in between. The U.S. economy, meanwhile, continues to move ahead steadily. Despite challenging weather, risks of trade wars, and tightening labor markets, corporate earnings are accelerating and consumers are still feeling very confident. We may be getting into the later stages of this economic expansion, but do not see the turn coming in the very near future.
While the economic backdrop is positive, we are looking carefully at the factors that may start to flash as the next downturn approaches. In this post, we will look at some of those indicators and gauge where they are currently and how, and when, they might start giving us a warning.
Trade Disputes
The most commonly cited concern for the economy today is the impact of trade disputes. The Trump administration has already put tariffs on certain imported goods and has threatened more. Other countries, in response, have countered by putting tariffs on our goods. If this back and forth escalates into a trade war, increasing costs to companies and consumers could halt the current momentum of the economy.
Many companies have already made statements regarding the impact that currently proposed tariffs will have on their bottom line. This is definitely something that should be carefully monitored.
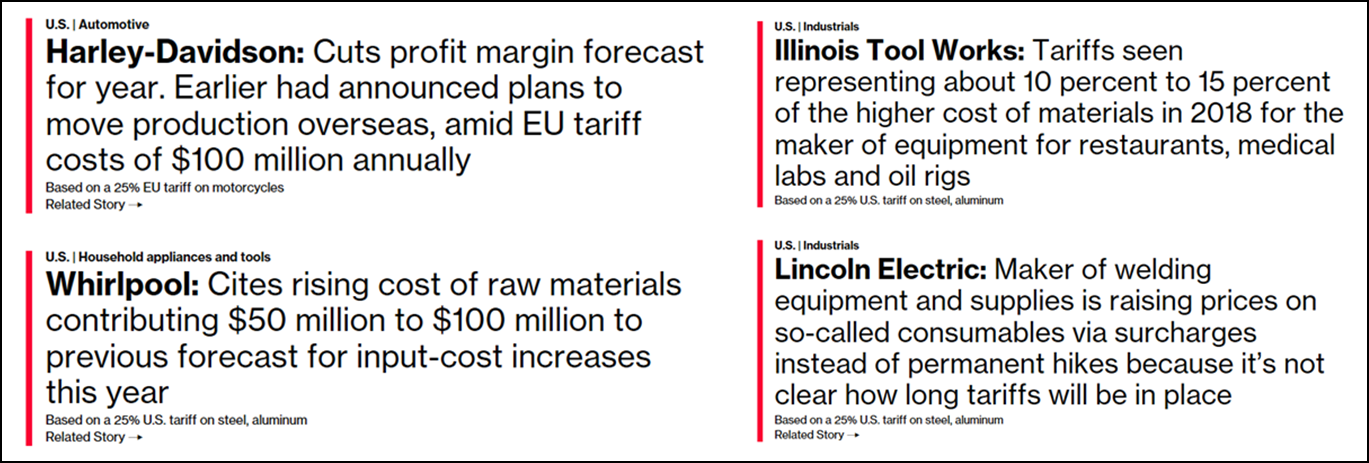
Despite these very real concerns, earnings expectations for the remainder of this year are still positive overall. Our expectation is that current tariffs are a base from which further negotiations will take place. None of the countries involved are interested in seeing this dispute escalate from here. Risk of increasing tariffs is low while a reduction is possible.
The Yield Curve
Another popular reason for concern that the economy is in danger is the fact that the yield curve is flattening and could become inverted. What does this mean?
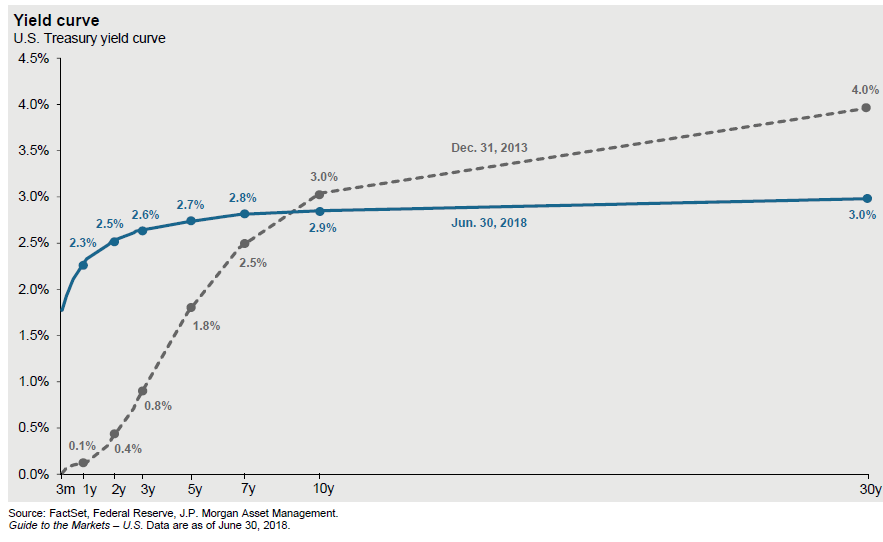
The yield curve is simply the line connecting the different levels of interest rates paid by the U.S. government on debt securities of different maturities. For instance, as of June 30th, a 3-month T-Bill paid you 2.00% annualized. A 2-Year bill paid 2.5% per year and a 10-Year Note, 2.9% per year. The extra 0.9% is the amount you earn for your willingness to keep your money with the U.S. for 10 years as opposed to only 3 months.
If you compare those rates to what they were 5 years ago, (figure 2) you can see that ‘curve’ is flattening out. In 2013, a 2-year obligation from the United States would only pay 0.4% while the 10-year paid 3.0%. That’s a spread of 2.6% – much ‘steeper’ than it is today.
Investors often interpret long-term interest rates as a forecast for future growth. So if the curve is flat or inverted (short-term rates become higher than longer-term rates) that means the market is expecting growth to slow or even shrink, which is the definition of an economic recession.
As you can see in figure 3, it has been a fairly consistent indicator. At least going back to the late 70’s, when the yield curve became inverted, (10-year rate below the 2-year rate) it was followed by a recession.
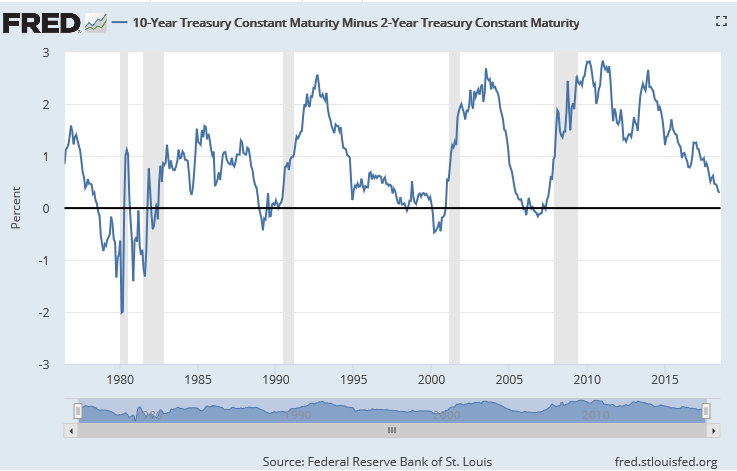
Where are we now? Just because the yield curve is flat, does not necessarily mean it will invert. Again, looking at figure 3, we see that the yield curve got very flat in 1995, but did not invert until 2000. If interest rates are expectations of future growth, we can still see reasons why the 10-year rate could increase from here. One of the things holding it below the 3% level is that interest rates in the rest of the world are so low. Rates in Germany are 0.5%, the U.K. is at 1.3%, and Japan is offering a measly 0.1% on its 10-year rates. Compared to those countries, the 3% in the U.S. looks like a tremendous deal.
Whether short-term interest rates continue to go higher will be largely based on our next topic.
Inflation
Why would the Federal Reserve (the Fed) continue to raise short-term interest rates? Well, the Fed has two mandates. 1) to promote full employment and 2) to promote price stability (keep inflation in check)
Since the financial crisis, the Fed has kept short-term interest rates very low. They have also been pumping money into our economy hoping to get growth reignited and more people back to work. We are now seeing the labor market improve to where we are seeing a 4% unemployment rate. That is historically very low, and economists are calling that ‘full employment’. (You cannot expect 0% of unemployment because of the frictions and movement of the labor force. There will always realistically be some people who lose/leave their job and are out looking for a new one.)
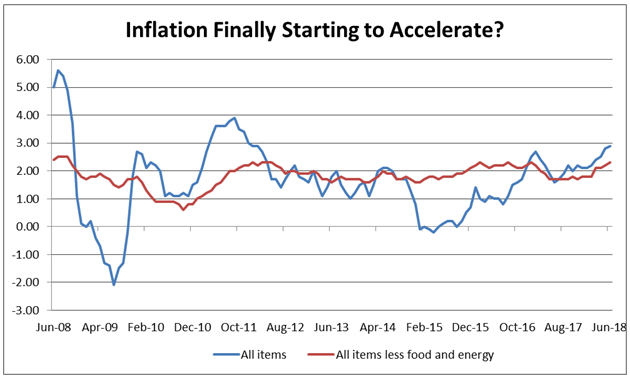
So the first mandate has been largely met. Now we move to the second mandate – to promote price stability. During the recovery, inflation has remained very low (figure 5) despite the worries that the Fed’s easy money policies to promote growth would cause inflation to spike. Currently, inflation numbers are starting to pick up and the Fed may need to accelerate interest rate increases to ensure that inflation does not get too high. They have a target inflation of 2% (some price growth in the economy is positive) and we have reached that. What will be the Fed’s response if inflation goes up to 3% or 4%?
Bottom Line
The most recent reading for GDP growth came in above 4%, which is a healthy number for the quarter. Consumers are still feeling good, and if wages start to rise because of the tight labor market, we can only expect that to continue. Manufacturers are expanding and feeling good too. The Institute for Supply Management (ISM) Purchasing Managers Index (PMI) for June came in at 60.2 – a reading above 50 means that manufacturers are optimistic and expanding. May’s number was 58.7 so it is positive and accelerating. That is a good sign.
Earnings growth of corporations has also been very positive. Profits of the largest U.S. based companies are expected to grow by close to 25% for 2018. Despite tariffs and tight labor markets profits are growing and growing fast.
Overall, the economic backdrop is very positive. Barring some kind of shock to the system, the economy should continue being supportive for at least the short-term. Therefore, we are still fully invested in stocks both in the U.S. and overseas.
The three situations explained above will be very important for outlook going forward. If trade disputes pull down growth expectations, that could keep long-term interest rates down, while if inflation starts to pick up, the Fed will continue to increase the short-term rates. With the yield curve already flat, it would not take long under that scenario for it to invert, which as shown above, has proven to be a reliable indicator of an impending recession.
We are enjoying the good economy right now, but watching closely. This Midwestern summer has been another example that conditions can change quickly. We consider it our primary responsibility to our clients to be prepared for any weather that comes our way.
If you have any questions about this update or your account in particular, please reach out to our Trust & Asset Management Team. We look forward to hearing from you.

Keith J. Akre, CFA, CFP® – Trust Officer
Opinions expressed are solely my own and do not express the views or opinions of Stillman Bank. Investments available through Stillman Trust & Asset Management (1) are not FDIC insured (2) are not deposits, obligations, or guaranteed by the bank and (3) are subject to investment risk including possible loss of principal.