Economic Outlook – Winter 2023 | “Short-Lived Turbulence”
There is no question that 2022 was a difficult year for investors. The rapid rise in interest rates presented significant headwinds to both the stock and bond markets. The Bloomberg Aggregate Bond Index was down 13.1% as of December 31, 2022. The second worst year occurred in 1994 when the index was down just 2.9%. Similarly, the S&P 500 was down 18.11%. With neither equity nor fixed income providing any relief, investors were left with nowhere to hide. Looking ahead to 2023, the primary concern is around the probability and/or severity of an economic recession. We explore this concern in detail and its impacts on financial markets below.
The Yield Curve
To start, the level of interest rates at different periods (the “yield curve”) has historically acted as a quick visual to provide insight into what the broad markets are expecting. An “upward sloping” yield curve, where long-term rates are higher than short-term rates is considered normal and indicative of a growing economy. This signals that investors expect interest rates to be higher in the future than they are today. The current yield curve, however, is “inverted” or downward sloping after 12 months as indicated in the chart below.
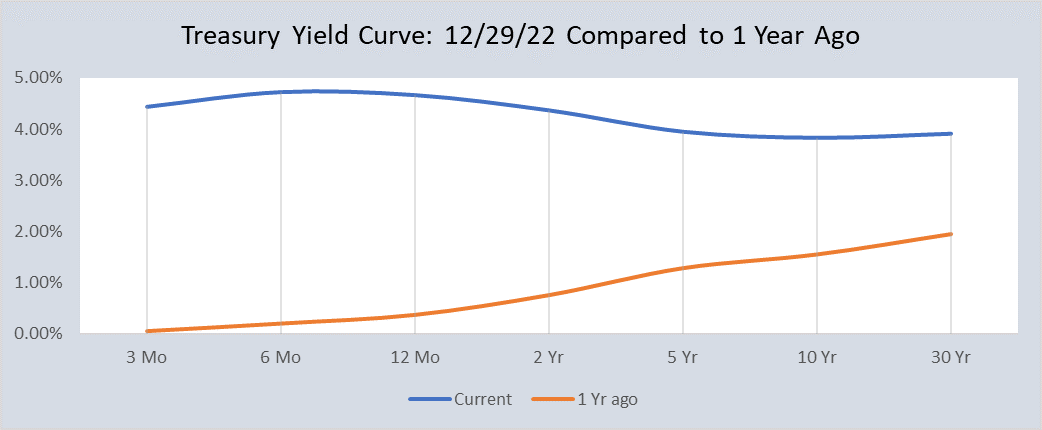
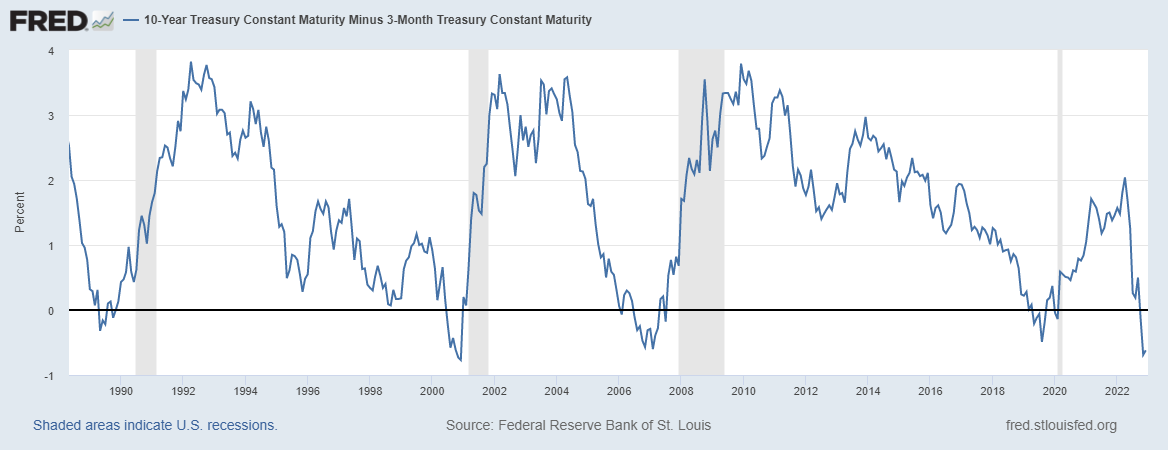
It is worth pointing out that recent recessions were precluded by inverted yield curves and negative spreads. At its peak, the 3-month T-bill was yielding 90 basis points more than the 10-year note (a spread not seen since late 2000). This is strong evidence of a recession beginning in 2023.
The Federal Reserve
Central Bank policy will continue to provide headlines in the new year. As of the December meeting, the Federal Reserve Bank, “the Fed”, has increased its benchmark Fed Funds rate by 425 basis points since February to 4.50%. Since April, the Fed raised this rate by 75 basis points every meeting, up until December when they raised it by 50 basis points.
This is Reminiscent of Paul Volcker, the anti-inflation Federal Reserve Chairman who waged war on 1970s-era inflation before the recession of ’80-’82. These two eras are fundamentally different, however, Volcker was raising rates in response to runaway inflation in the 70s, whereas the current Fed Chairman, Jerome Powell, is raising them to prevent such inflation from returning. The early 80s were also plagued by double-digit unemployment rates not present currently.
How does the Fed view progress in its battle against inflation? The chart below compares PCE (the Fed’s preferred measure of inflation), PCE excluding the volatile food and energy prices, the Fed’s benchmark rate, and the 2% target the Fed shoots for.
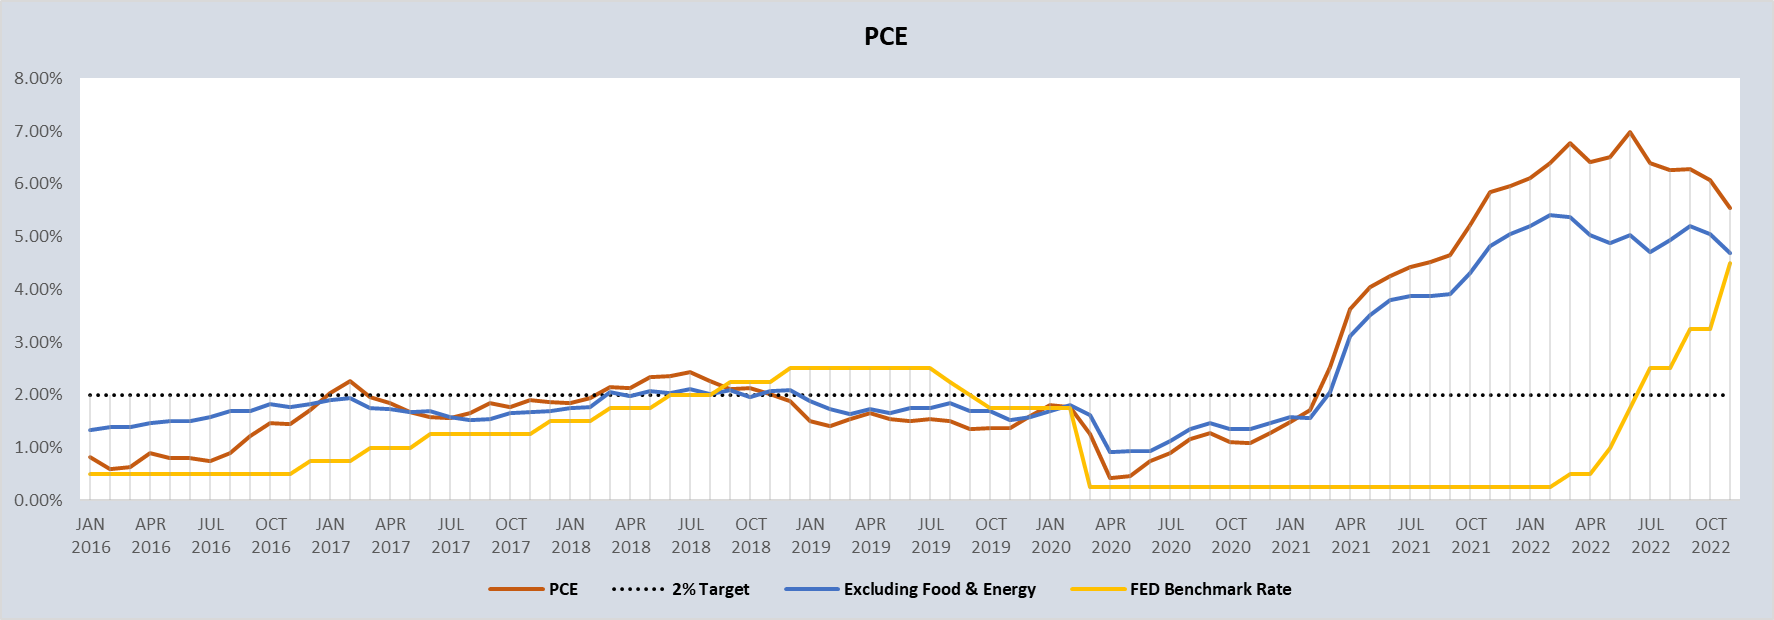
As we can see, the PCE was below the Fed’s 2% target for the 2 years preceding 2021. Initially, the Fed believed rising costs were “transitionary” and would subside. However, as the PCE level continued to rise, the Fed finally took action in Spring of ’22.
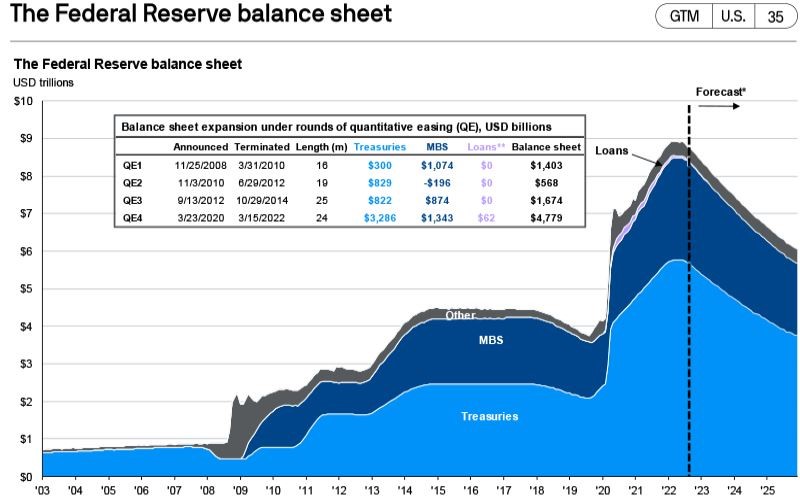
Besides explicitly raising the Fed Funds rate, the Fed can also influence rates by controlling its balance sheet. To help reduce interest rates in the aftermath of COVID, the Fed began increasing the number of assets they purchase (they more than doubled the size of their balance sheet by the end of 2021). Known as “quantitative easing” the goal of the Fed was to provide liquidity and ultimately reduce yields on mortgage-backed securities and Treasuries. Starting in 2022, the Fed switched their efforts toward taming inflation, and therefore began “quantitative tightening”, or selling these assets to have the inverse effect. The Fed announced they plan to shrink their balance sheet, albeit by a smaller amount than originally claimed.
The Consumer
One concern for the economy is that consumers will stop spending due to recession fears. The University of Michigan does a poll on Consumer Sentiment which measures a consumer’s expectation of earning more money and making large purchases in the upcoming months. Consumer sentiment can potentially provide a look into future inflation inputs: less anticipated spending could mean falling prices on goods and services but also recession expectations.
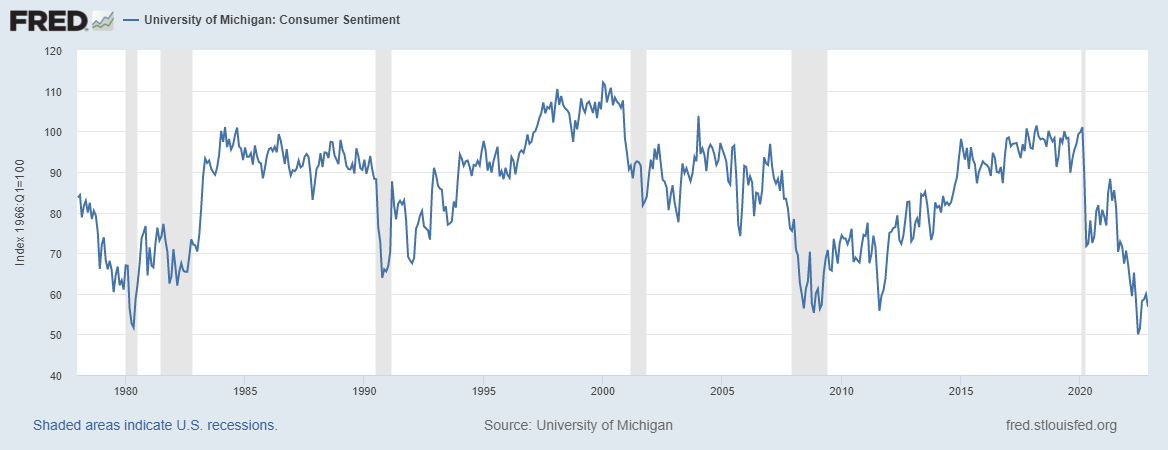
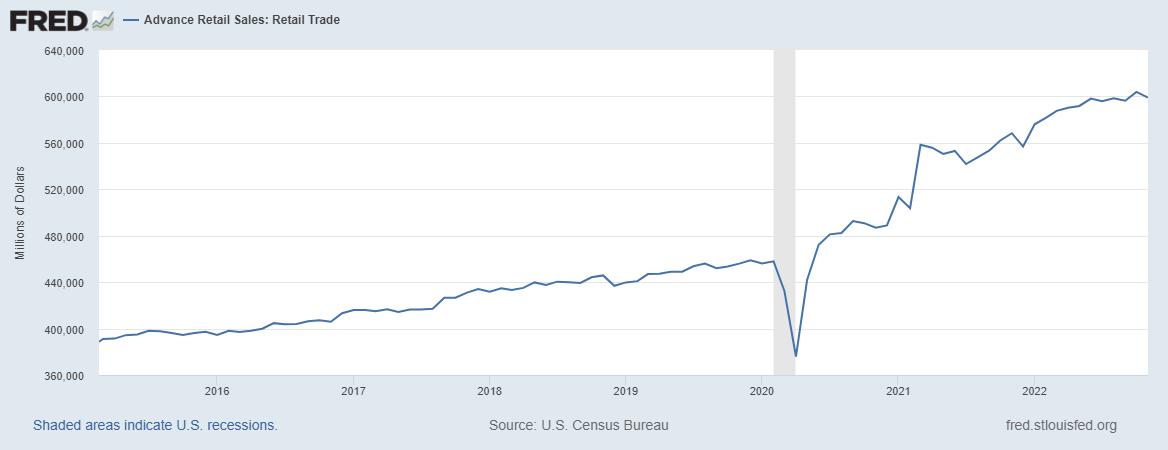
Consumer sentiment, however, is not translating directly into reduced spending. From the chart below, we can see the trend in consumer spending has continued to increase.
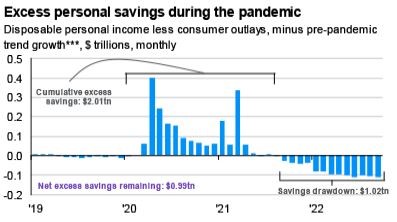
How have the policies enacted in the aftermath of COVID affected consumers’ pockets? After all the stimulus was injected into the economy, we saw roughly $2.01 trillion in excess savings by consumers. Beginning halfway through 2021 to current, we have seen net drawdowns of roughly $1.02 trillion. There is still $990 billion in excess savings remaining. This has been a huge propellant of inflation and should remain so until excess savings return to pre-COVID levels.
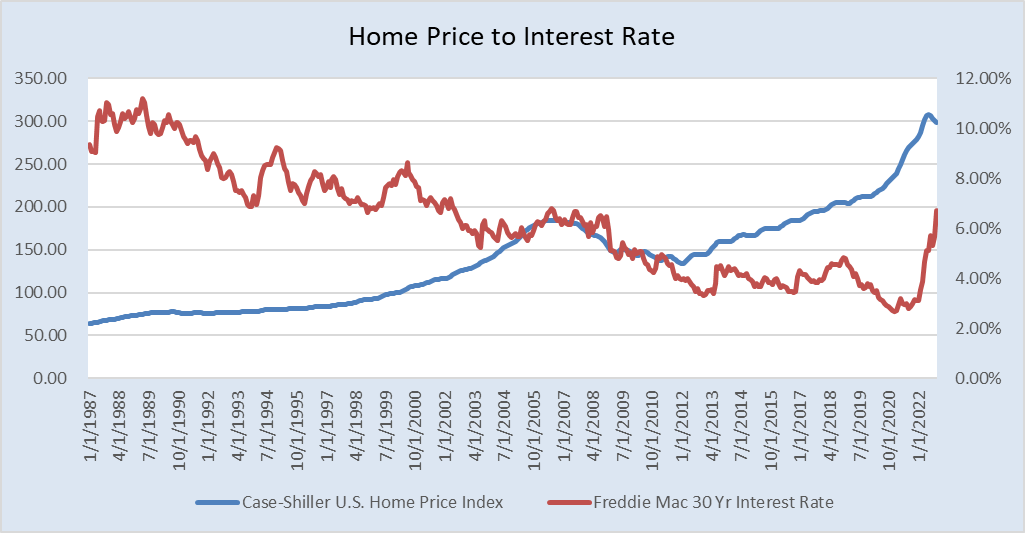
The Housing Market
The housing market continued to be a pain point for consumers through 2022. The Housing Affordability index from the National Association of Realtors below shows that the average consumer is now having a hard time qualifying for the average house on the national market (signaled by any reading below 100).
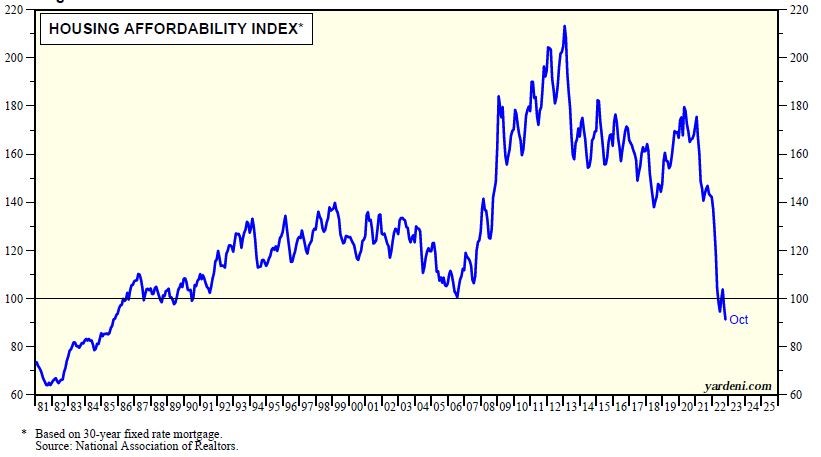
Plummeting mortgage rates following COVID led to nationwide bidding wars on houses, leading to a shortage of inventory, ultimately causing home prices to skyrocket. Rates have been rapidly rising, albeit slower than the price of homes is falling, as illustrated by the below chart. The Simultaneous rise in rates and price have contributed to the dip in housing affordability mentioned above.
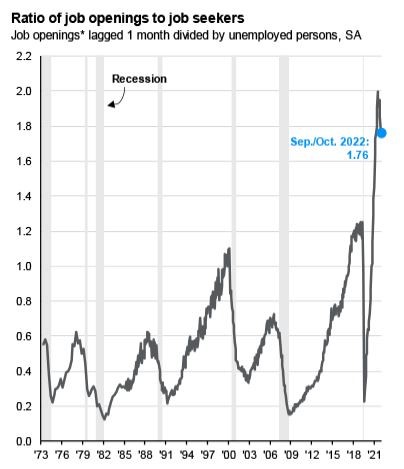
The Labor Force
What implications does all this have on the workplace? The ratio of job openings to job seekers is off the 2X figure previously seen but remains elevated. This shortage of workers has led to increases in wage growth, which we discuss further below.
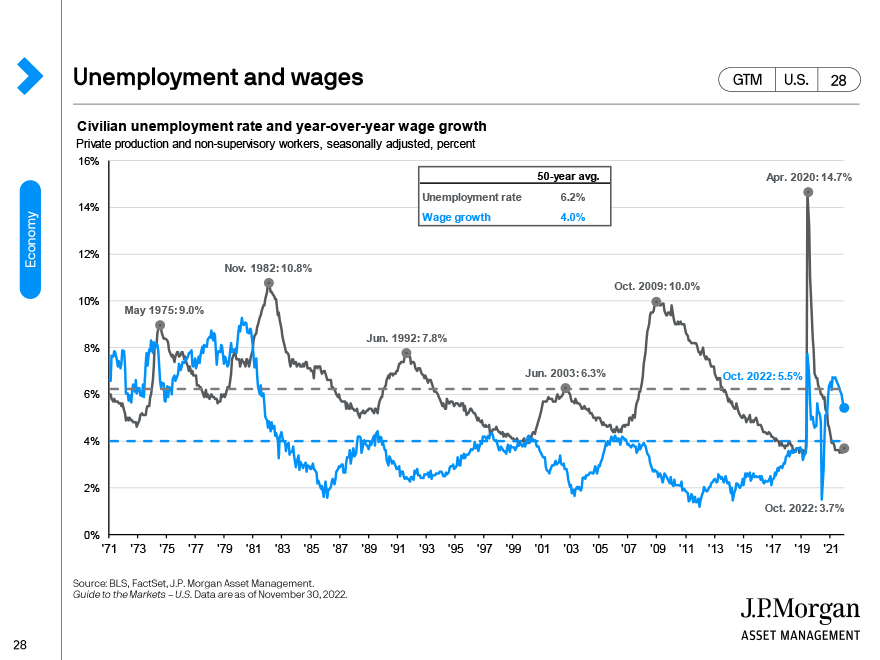
Following the mass shutdowns resulting from COVID, the unemployment rate has precipitously fallen from its high of 14.7% to 3.7%. Much like the demand for labor mentioned above, wage growth has also seen a steep climb, another factor contributing to high inflation and one the Fed is closely watching. Wage growth seems to be moderating as of late.
The Bottom Line
“Turbulence” seems to be the phrase assigned to 2023. While we believe this descriptor is accurate, the strength of consumers and corporate balance sheets provide hope that it will be short-lived. Similarities can be made between the current economic environment and those of past recessions; the high inflation of the 70s and 80s, the home price appreciation of the 2000s, and the negative spreads preceding all. None are identical, however, and many of the major underlying issues found in past downturns are not present today. For reference, here is a chart of the S&P 500 bull and bear markets since the 1920s. Horizontally we see the duration and vertically we see the magnitude.
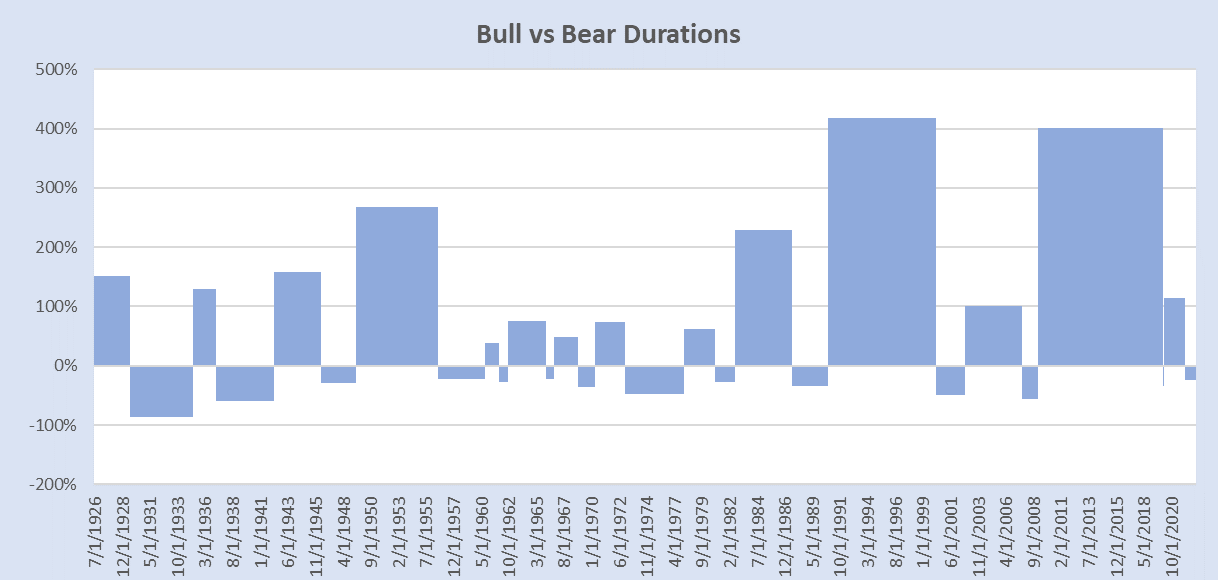
As you can see, the upward bars of the bull markets dwarf the downward boxes of the bear markets. Looking at today’s bear market in this context is useful for keeping things in perspective. Our advice has not changed much in the past year or two. If you have upcoming cash needs, make sure that money is safe. Money that will not be needed for 5 years or more will have an overwhelming likelihood of outperforming bonds or cash if invested in the stock market.
Heading into 2023, we are conservatively allocated compared to our benchmarks. We are underweighting our target stock allocation due to uncertainty around economic conditions. Within our stock allocation, we are overweight to value to emphasize quality, non-cyclical earnings. Within our bond portfolios, we are tilted towards short duration to reduce interest rate risk. We will continue to monitor economic data as it is released and make any changes necessary.
If you have any questions about the current market environment, please don’t hesitate to call us. We look forward to helping.

Eric Haugdahl – Investment Associate

Keith J. Akre, CFA, CFP® – Vice President & Trust Officer
Opinions expressed are solely our own and do not express the views or opinions of Stillman Bank. Investments available through Stillman Trust & Wealth Management (1) are not FDIC insured (2) are not deposits, obligations, or guaranteed by the bank and (3) are subject to investment risk including possible loss of principal.