Economic Outlook – Winter 2024 | “Is the Fed Going to Cut-It-Out?
Interest Rates Did Not Break Through the “Ceiling”
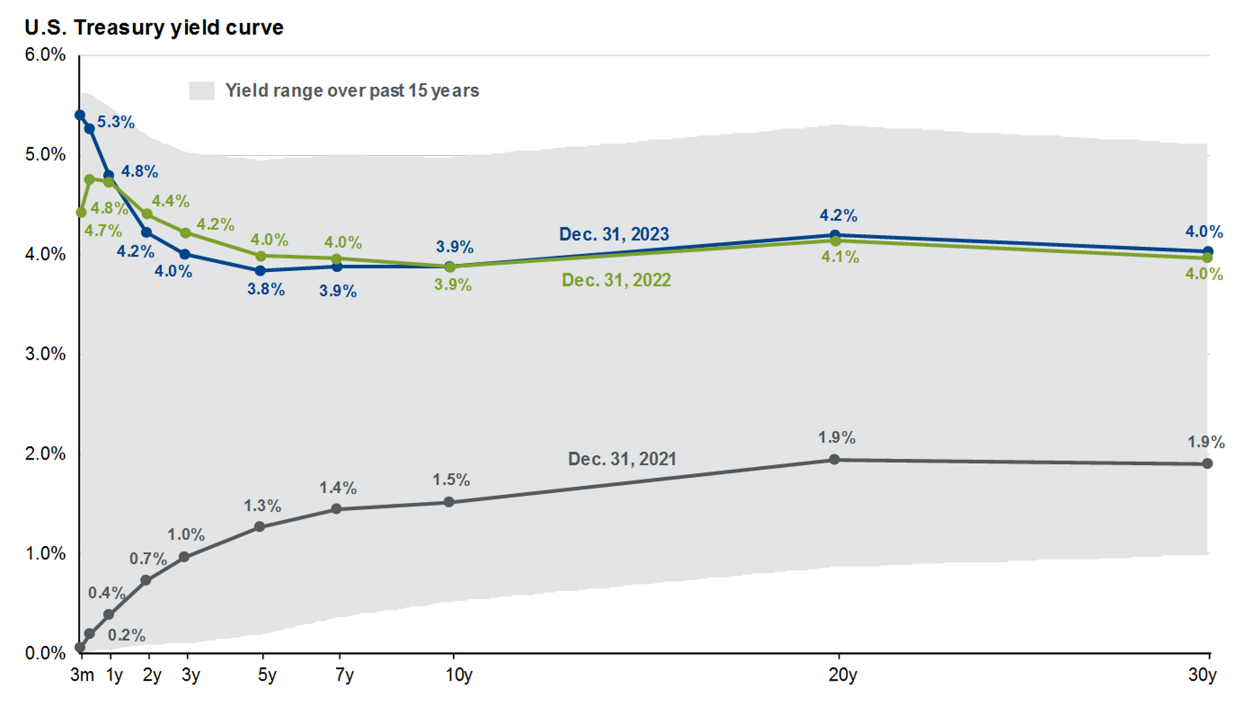
Financial markets rallied in the 4th quarter of 2023 as the Federal Reserve signaled it may be ready to cut rates after 18 months of “tightening” policy. The yield curve below as of December 31st reflects the Federal Reserve’s statements. This is illustrated by the absence of the “hump” at the short end of the curve from December 31, 2022, to December 31, 2023. It is worth pointing out that the grey-shaded area is the range of interest rates over the past 15 years. As of our last quarter’s update, the yield curve was pressed against the upper boundary represented by the dashed red line. The question was whether rates would break through this “ceiling.” This did not happen, and interest rates fell from that point.
Where will interest rates go from here? The short answer is no one can know with certainty. We can, however, look at what other large institutional investors believe will happen via Fed Fund futures contracts. Fed Fund futures contracts are bought and sold by large institutional investors to hedge short-term interest rate fluctuations. We can gain insight into their expectations of what the Fed will do by looking at these open positions.
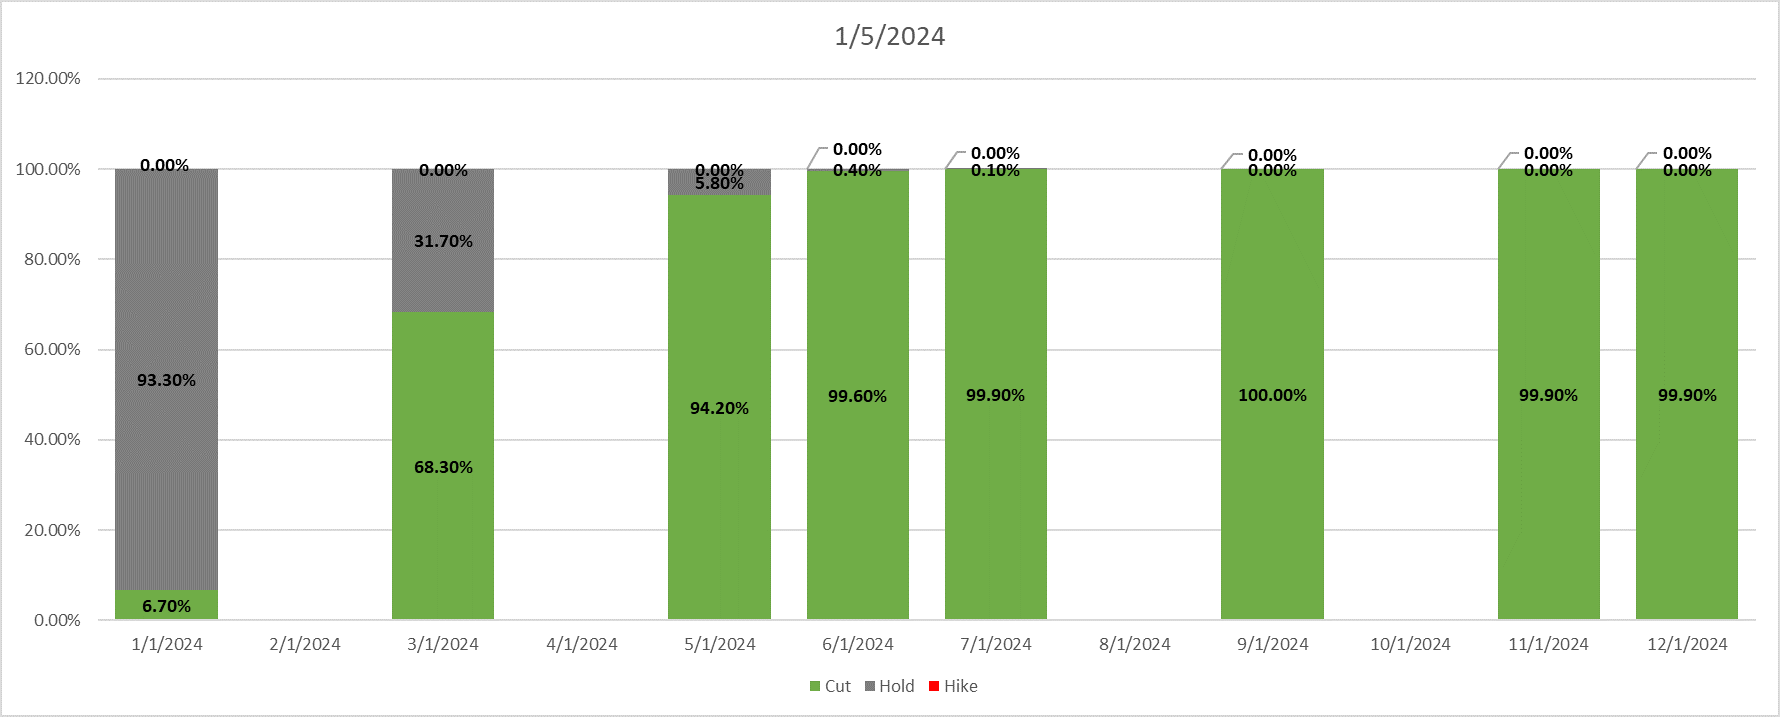
Each bar in the chart above represents the Fed’s meeting schedule in 2024. Based on the futures contracts we can see that 99.60% of the market believes interest rates will be lower by June 2024; the details say 88% of the market thinks short-term rates will be 50-75 basis points lower. What about long-term interest rates? Long-term growth and inflation expectations have the greatest impact on the direction of those rates. Many investors believe the “higher for longer” scenario – if the economy stays resilient and the Federal Reserve’s dual mandate is met, rates will remain elevated as there would be no reason to cut them.
Inflation and the Bond Market
Markets are still hinging on economic data revolving around inflation. We mentioned in our last update that Inflation disrupts the normal balance between stocks and bonds and limits the hedging power bonds have in a diversified portfolio. Bond prices are inversely related to interest rates. Stated another way, as interest rates increase, the price an existing bond can be sold for decreases and vice versa. Additionally, the longer the maturity date is, the larger the impact interest rates have on prices.
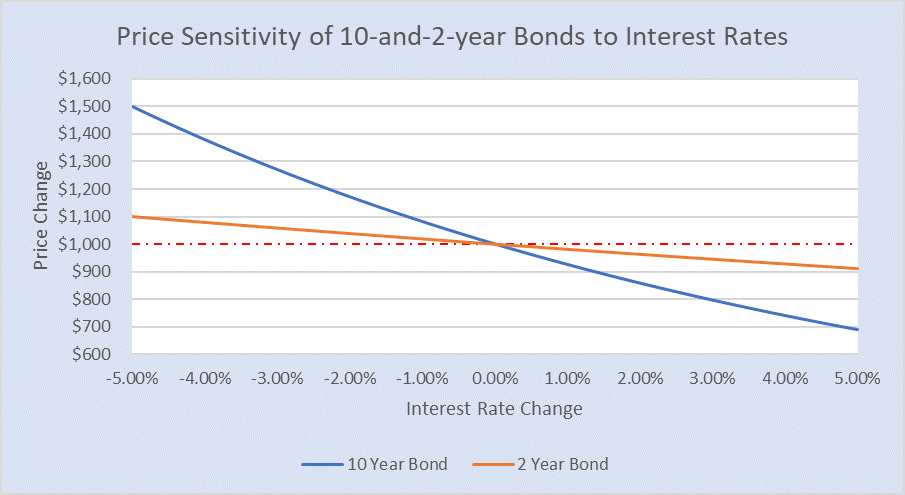
With interest rates moving in both directions so rapidly lately, it will be helpful to explore the impact this can have on a bond strategy. The below chart compares the price movement of a 2-year and 10-year bond in various interest rate movement scenarios. Price movement is illustrated on the vertical axis, and interest rate changes are illustrated along the horizontal axis. We can see that as we slide left to right on the horizontal axis (interest rate changes), the vertical movement of the 10-year bond (blue) is much more extreme than the 2-year bond (orange). Specifically, if interest rates decrease by 1% the 10-year bond increases in value by 8.18% compared to the 2-year bond gain of 1.90%. The other side of this is the protection that the 2-year bond provides if rates increase by 1%. The 10-year bond price decreases by 7.44% whereas the 2-year bond price decreases by only 1.86%.
Shorter maturity bonds experience less price fluctuation. Many investors have taken advantage of these short-term bonds that exhibit low volatility and, since the yield curve is inverted, provide higher short-term yields. There is a reason long-term yields are lower: investors believe these short-term yields are going to decline.
How Much Credit Goes to the Fed?
The below chart illustrates the Consumer Price Index (CPI, or the average yearly change in cost of goods), and the effective Federal Funds rate (or the rate the Fed charges to banks who need to borrow). Inflation has come down from its high of 9.1% in June of 2022 to 3.4% in December 2023.
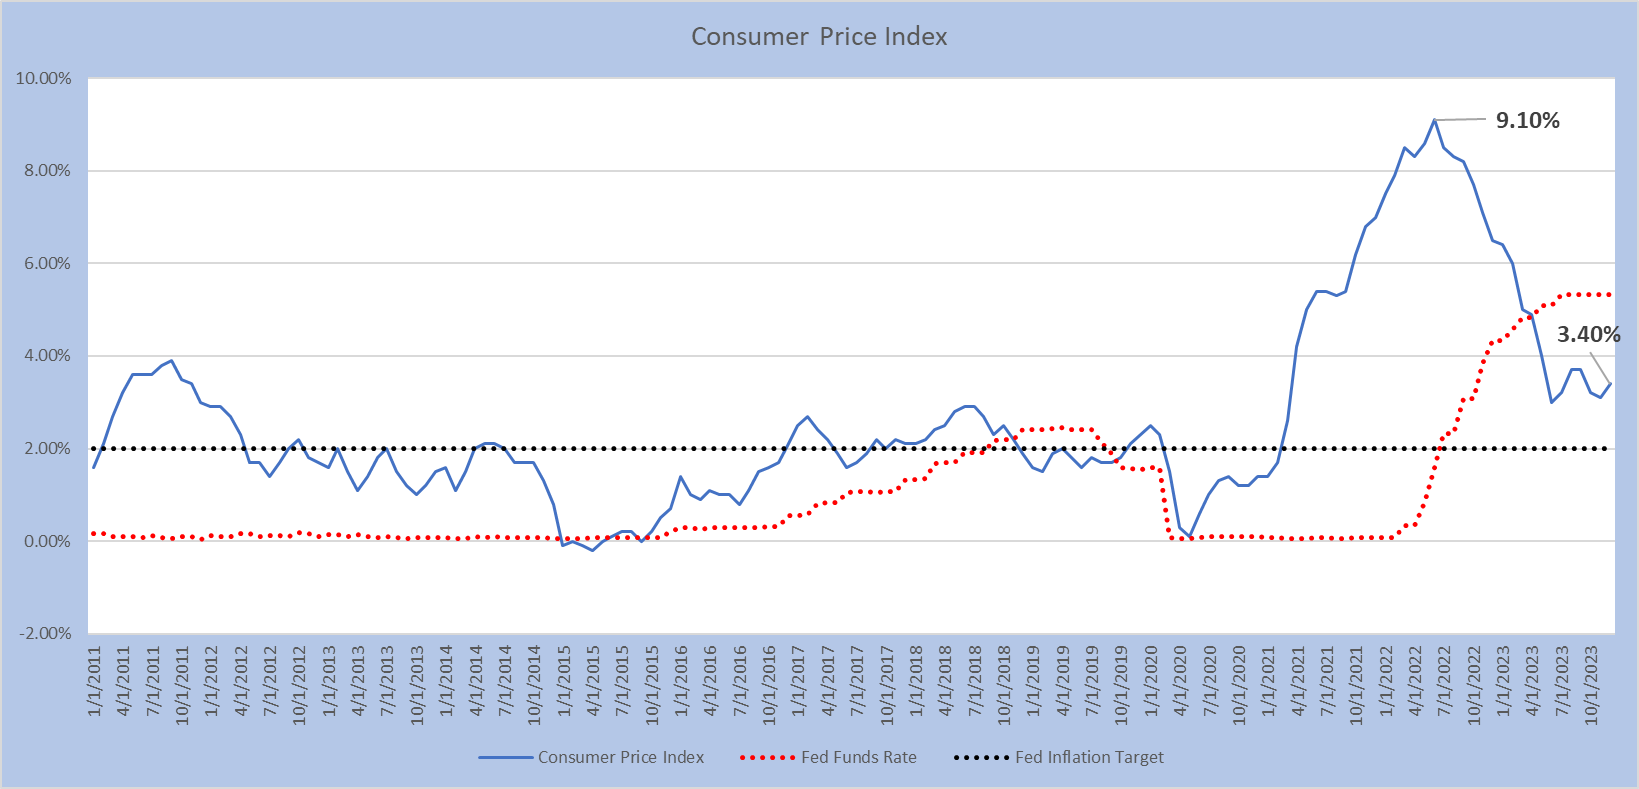
While there is certainly a strong correlation between the Fed raising the overnight borrowing rate and the downward path of inflation, it is debatable how much of an impact the Fed’s hiking cycle truly had on inflation. Three major occurrences created the higher prices we are seeing today; supply chain disruption from shutdowns because of the pandemic, an influx of consumer savings due to the stimulus money distributed to limit the effects of the pandemic, and energy prices increasing due to the war in Ukraine and now tensions in the Middle East.
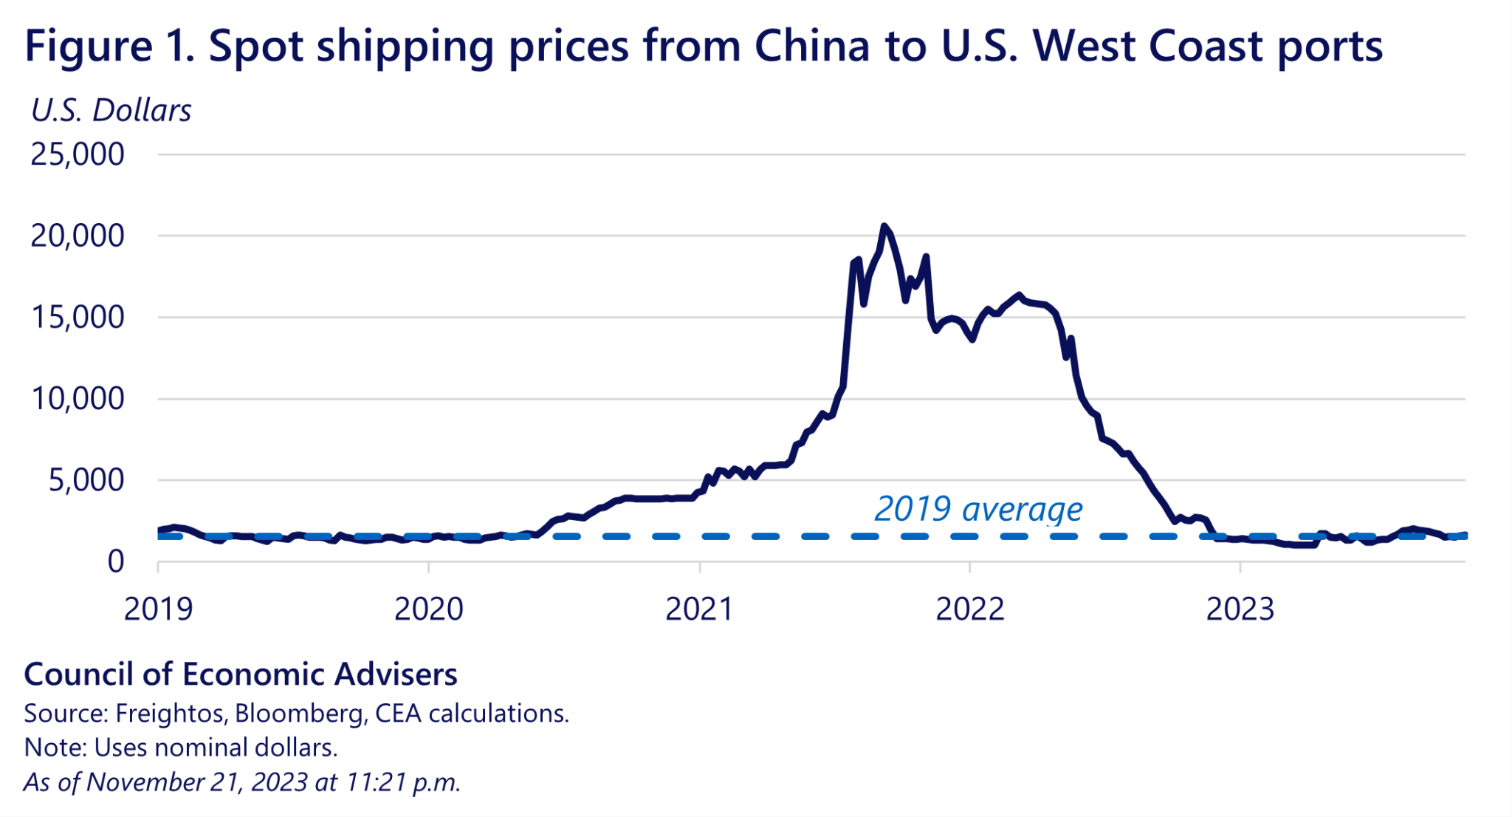
Below is a chart of the spot price to ship from China to the US west coast ports. Due to the shutdowns resulting from the pandemic, disruptions and delays at ports increased shipping costs by more than 1,000% from the average pre-pandemic cost! As we can see, prices have come down from their highs, certainly helping the Fed with its fight against inflation.
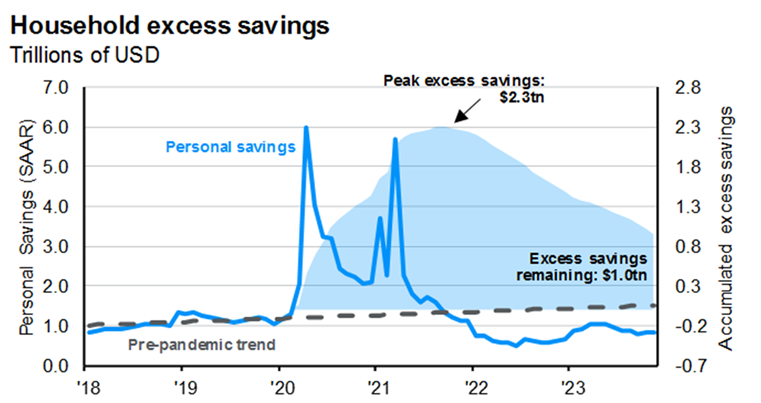
Higher shipping and transportation costs due to supply chain and logistical inefficiencies resulting from the pandemic were compounded by the fact that consumers had an influx of excess savings and were turning their demand to goods rather than services. The below chart illustrates excess savings in US households. While these savings have been getting used up, there is still a sizeable amount remaining which is one potential reason the economy has continued to expand despite the increase of interest rates. Not all $1.01 trillion of excess savings may be residuals of the pandemic stimulus; since 2021, money market funds and bank CD inflows have increased over 2 times the average rate in the last 10 years due to the return cash is providing currently. This could mean the average consumer savings are not as plush as the below figure might lead us to believe. This could also bolster stock and bond markets. If interest rates decline, and the premium for owning riskier assets increases, the excess cash below could provide substantial inflows to riskier assets.
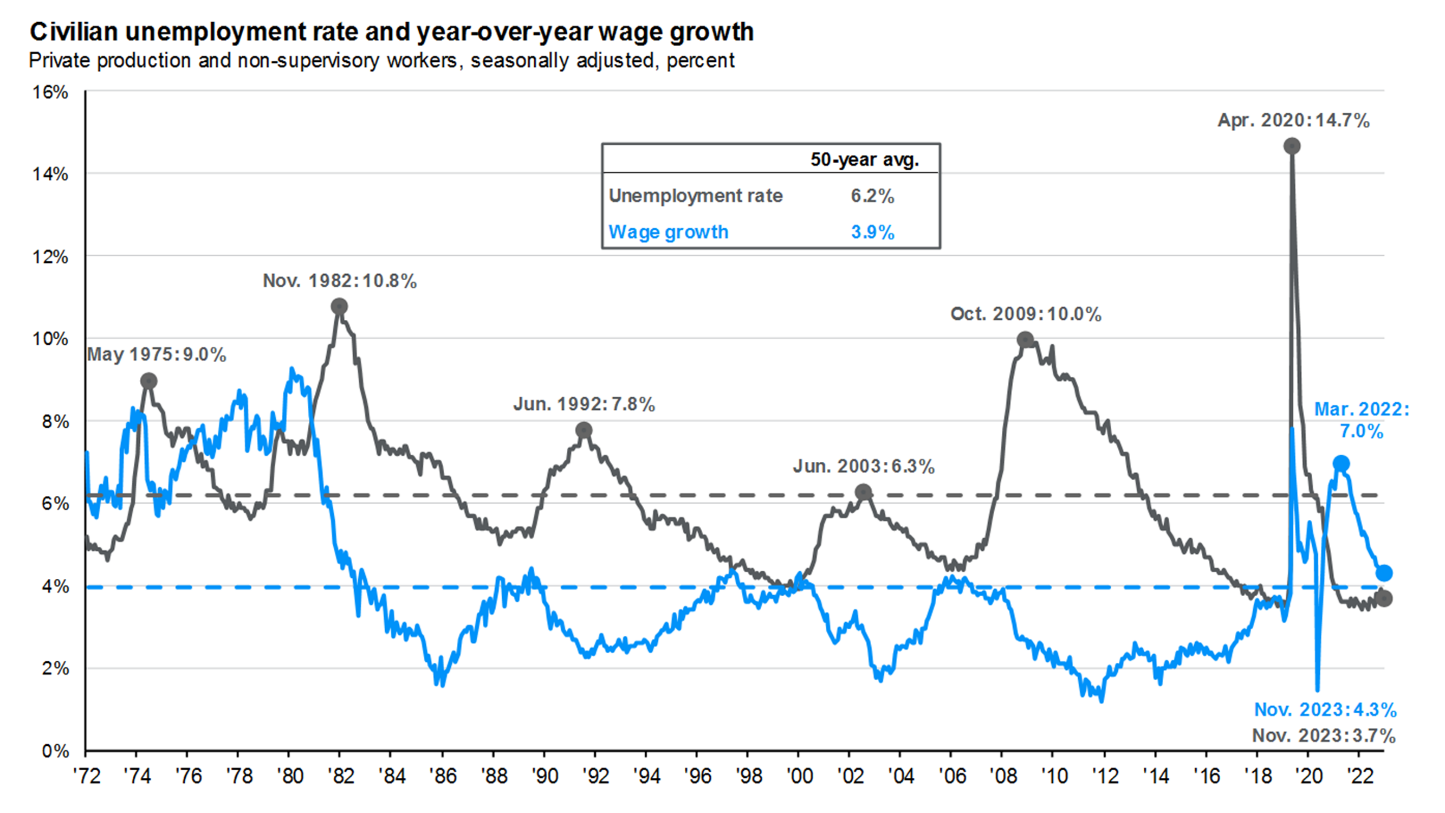
We mentioned before that several forecasters believe the “higher-for-longer” interest rate scenario – the Federal Reserve will keep rates higher than projected. This is supported by looking at the Fed’s dual mandate of price stability (limiting inflation) and maintaining full employment (controlling the unemployment rate). We can see from the below chart that unemployment of 3.7% as of November 2023 is still well below the 50-year historical average of 6.2%. From the above charts, we have seen inflation moderating as of late, but not quite to the 2% level the Fed would like to see. This combination of healthy employment and yet-to-be-defeated inflation could mean higher interest rates for longer.
The Bottom Line
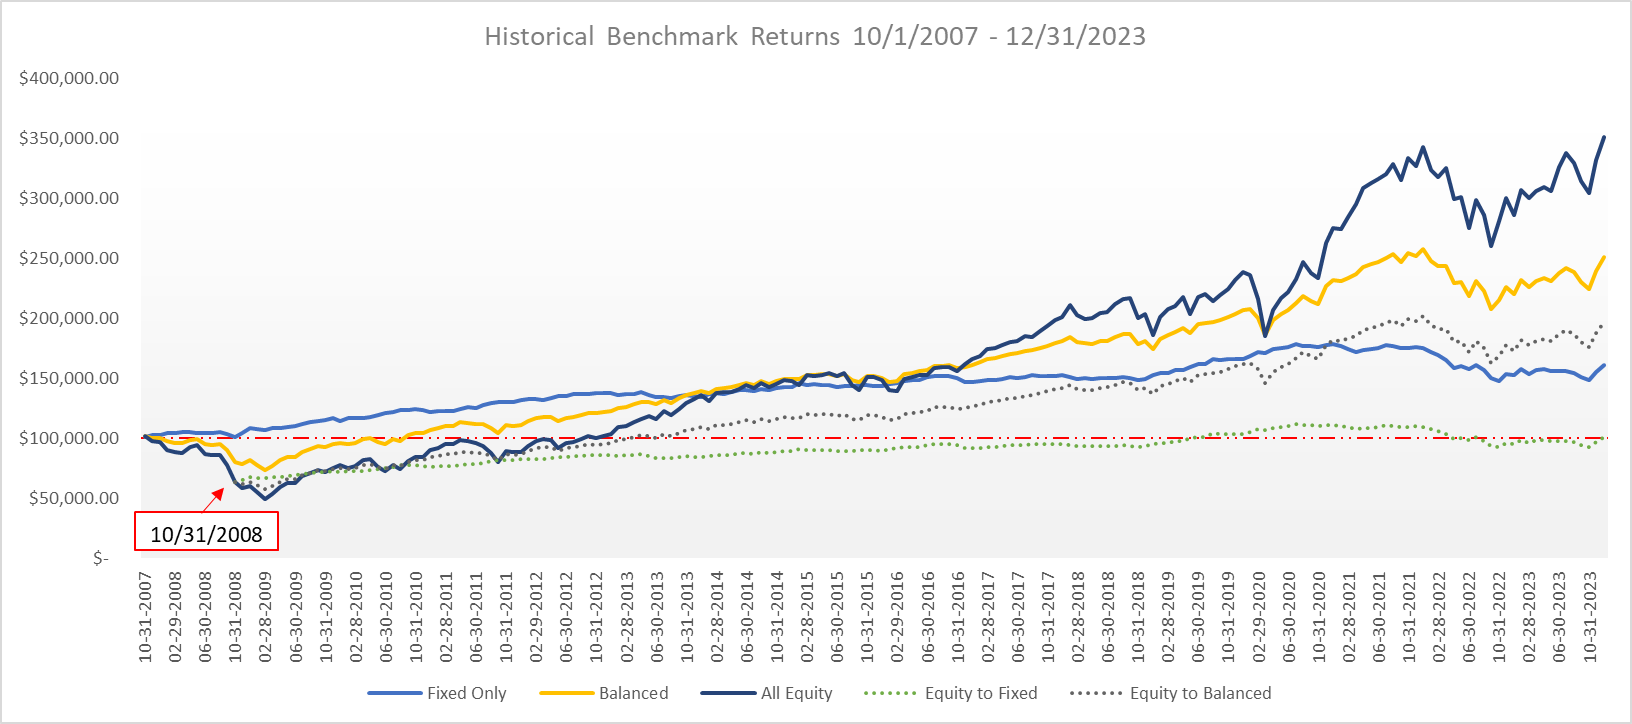
We continue to stress a long-term approach to investing. A carefully crafted investment plan, executed with discipline from the outset can reduce negative impacts caused by hastily made decisions. Reactionary decisions of getting in and out of the market tend to be the biggest obstacle to an investor reaching their financial goals. The below chart details benchmark returns from October 2007 (the market high before the credit crisis in 2008-2009) through the present. Portfolios of diversified stock (all equity), bonds (fixed only), and 50% each (balanced) are represented. We then assumed two possible alternative paths; an investor starting in an all-equity portfolio but then switching on October 31, 2008, to a fixed-only portfolio or a balanced portfolio (represented by the dashed lines) just shy of the market bottom. We can see that stocks continued to decline in value through February 2009, but an investor making this change would be hindering their long-term goals. We can see had the investor continued the course and kept their all-stock portfolio, the value would have rebounded and exceeded all the other scenarios. Had proper planning been completed up front, and it was decided the investor should be in a balanced portfolio, much volatility would have been mitigated and the portfolio would have grown over time. We can see that an investor who sold their stock portfolio in October 2008 and purchased all bonds would have merely broke-even over 16 years compared to investing in bonds from the beginning and experiencing 60% growth.
Given the uncertainty of the economic backdrop, we are maintaining a conservative tilt in our asset allocation. We continue to monitor new and impactful economic data that could signal changes in monetary policy and market sentiment and make appropriate portfolio decisions to capture modest growth and limit downside volatility. If you have any questions about the current market environment, please do not hesitate to call us. We look forward to helping.
Contact Our Trust Department
Eric Haugdahl – Investment Associate
Keith J. Akre, CFA, CFP® – Vice President & Trust Officer
Opinions expressed are solely our own and do not express the views or opinions of Stillman Bank. Investments available through Stillman Trust & Wealth Management (1) are not FDIC insured (2) are not deposits, obligations, or guaranteed by the bank and (3) are subject to investment risk including possible loss of principal.